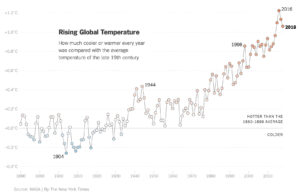
Rising Global Temperature
The points on the graph represent average temperature differences from
the 1880-1889 average, for each year from 1880 to 2018.
News Story | NGSS Standard: MS – ESS3 Earth & Human Activity

This material is based upon work supported by the National Science Foundation under Grant No. (IIS-1900606). Any opinions, findings, and conclusions or recommendations expressed in this material are those of the author(s) and do not necessarily reflect the views of the National Science Foundation.