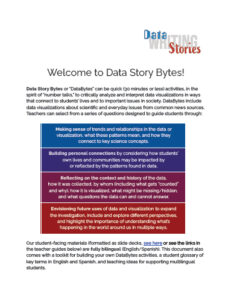
“DataBytes” are quick (30 minutes or less) activities designed for students to engage with data that tells a story.
Similar to “number talks,” they invite students to critically analyze and interpret data in ways that connect to their lives and the larger world.
The materials below are all products of Writing Data Stories, a collaboration between the University of California Berkeley, North Carolina State University, and the Concord Consortium funded by the National Science Foundation (NSF IIS-1900606).
Full DataBytes Curriculum
Includes lessons 1-8, instructions, slide decks, glossary, and DIY guide
Click image or button to download PDF
Individual DataBytes Lessons
Lessons 1 through 4 include data visualizations, slides, and discussion prompts
Lesson 1: Exploring Carbon Dioxide and Costs for Vehicles
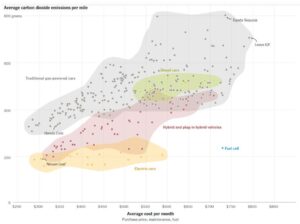
News Story | New York Times
NGSS Standard | MS – ESS3 Earth & Human Activity
Lesson 2: Climate Threats
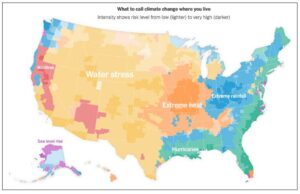
News Story | NGSS Standard: MS-ESS3 Earth & Human Activity
Lesson 3: Rising Global Temperature
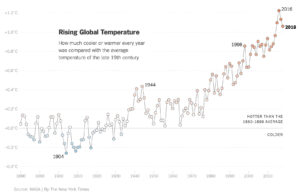
News Story | NGSS Standard: MS – ESS3 Earth & Human Activity
Lesson 4: Changes in Fish Habitat
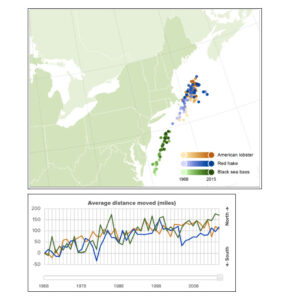
Data Source | U. S. Environmental Protection Agency
NGSS Standards | MS-LS2 Ecosystems: Interactions, Energy, and Dynamics; ESS3 Earth & Human Activity
Interactive DataBytes Lessons
Lessons 5 through 8 include visualizations, slides, and prompts.
In addition, they include files for interactive data editing through a platform called CODAP. It is free and open source, and accessible on a web browser.
For more info, check out this online guide, or download this step-by-step PDF intro!
Lesson 5: What’s Healthy
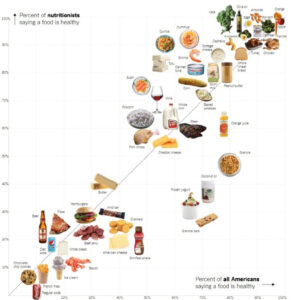
Data Source | NGSS Standards: LS1: From Molecules to Organisms: Structures and Processes
Bonus: View this DataByte as an Interactive CODAP file
Lesson 6: Global Temperature Change Predictions
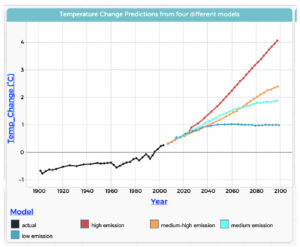
Data Source | NGSS Standard: MS-ESS3 Earth & Human Activity
Bonus: View this DataByte as an Interactive CODAP file
Lesson 7: Tracking Elephant Seals
Data Source | NGSS Standards: MS-LS2 Ecosystems: Interactions, Energy, and Dynamics; ESS3 Earth & Human Activity
Bonus: Engage with data for this DataByte as an Interactive CODAP file
Lesson 8: Examining Cereal Data
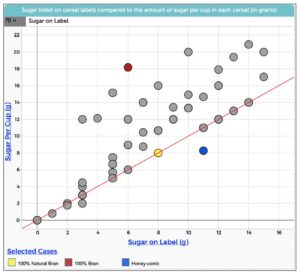
NGSS Standards: LS1: From Molecules to Organisms: Structures and Processes
Bonus: Engage with data for this DataByte as an Interactive CODAP file
DataBytes in the News
Bite-Sized Lesson Plan Competition: DataBytes Receives Honorable Mention!
Our DataByte What is Healthy: Making Sense of Graphs and Data Reported in Media received an Honorable Mention in Data Science 4 Everyone‘s first annual Lesson Plan Competition!
The What is Healthy? unit builds on our DataBytes discussion structure, which asks students to interpret graphs and data from media sources using not only in mathematical, but also personal and social perspectives. You can learn more about the general DataBytes approach here.
The first-place winner was a lesson by our colleague and DataBytes co-author Hollylynne Lee. Check out all the competition winners and honorable mentions!

This material is based upon work supported by the National Science Foundation under Grant No. (IIS-1900606). Any opinions, findings, and conclusions or recommendations expressed in this material are those of the author(s) and do not necessarily reflect the views of the National Science Foundation.