Exploring Carbon Dioxide and Costs for Vehicles
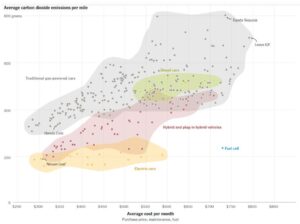
This graph shows the average amount of carbon dioxide released from a
vehicle per mile. It also shows the average cost per month for each type of vehicle.
News Story | NGSS Standard: MS – ESS3 Earth & Human Activity

This material is based upon work supported by the National Science Foundation under Grant No. (IIS-1900606). Any opinions, findings, and conclusions or recommendations expressed in this material are those of the author(s) and do not necessarily reflect the views of the National Science Foundation.