Global Temperature Change Predictions
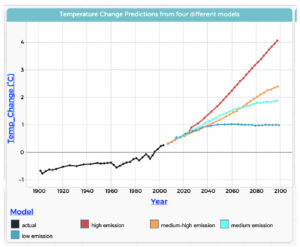
The black data points show how the average temperature in a given year
compares to the average temperature from 1985-2005. The other data points (from
2005-2100) show potential temperature changes based on 4 different levels of emissions.
Data Source | NGSS Standard: MS-ESS3 Earth & Human Activity
Bonus: View this DataByte as an Interactive CODAP file!

This material is based upon work supported by the National Science Foundation under Grant No. (IIS-1900606). Any opinions, findings, and conclusions or recommendations expressed in this material are those of the author(s) and do not necessarily reflect the views of the National Science Foundation.